Fashion Retail Predictive Analysis
Data-Driven Insights for a Profitable and Circular Fashion Future
Business Strategy & Objectives
Operational Inefficiency
The fashion industry is plagued by "deadstock", inventory that fails to sell and eventually reaches landfills. This project targets the intersection of financial loss and environmental waste.
Analytical Requirements
- Demand Forecasting: Implementing analytical tools to provide reliable, data-driven sales projections.
- Trend Mapping: Linking internal inventory to market sentiment as a Predictive Demand Signal.
- Ethical Accountability: Integrating sustainability metrics to align profit with a Circular Economy.
- JIT Enablement: Supporting 'Just-in-Time' production to eliminate the 20% average profit loss caused by inaccurate procurement.
Technical Architecture: The Star Schema
The solution is built on a custom Star Schema designed to handle multi-brand retail fashion data. This model allows for complex DAX measures calculated in real-time to support assortment planning and ethical procurement.
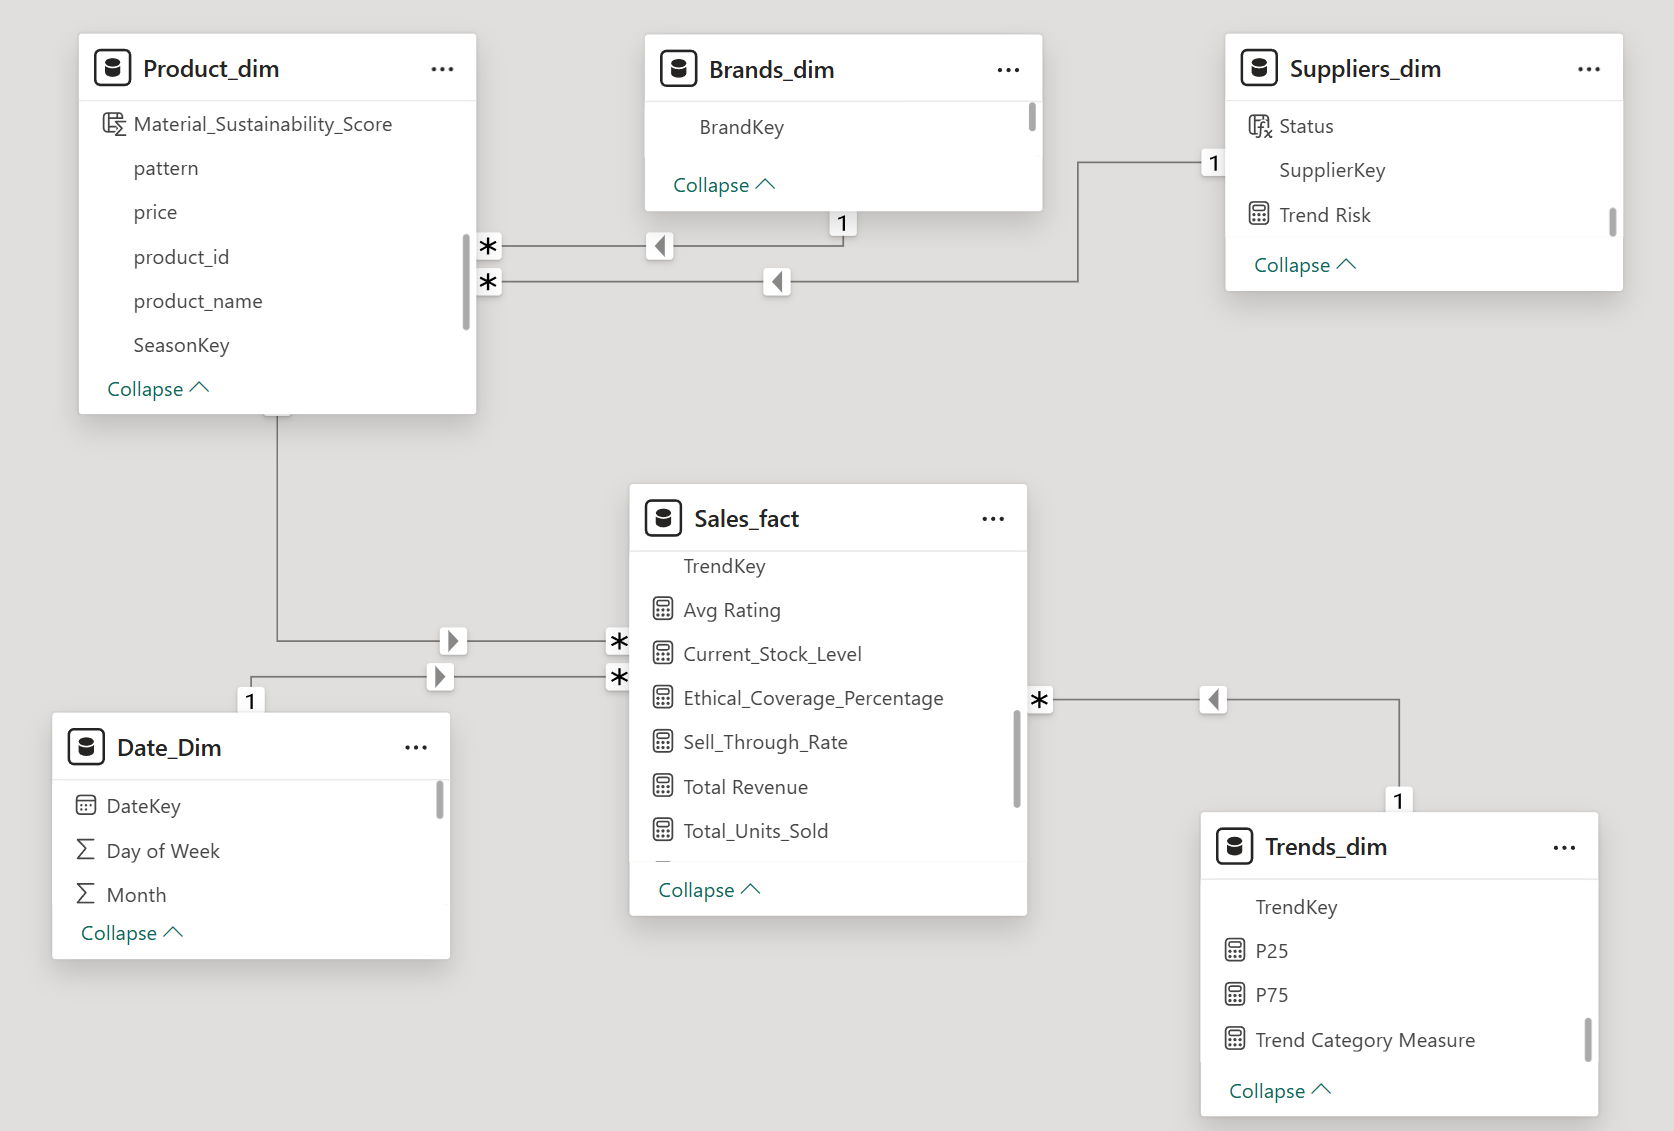
Figure 1: The Star Schema Architecture - Linking Sales Fact to Supporting Dimension tables.
Sales Fact
Granular transaction data linked via Product, Date, and Store keys.
Date Dimension
Connects via DateKey to enable time-series slicing and seasonal revenue forecasting.
Trend Dimension
Connects via a composite TrendKey to align transaction data with real-world fashion market sentiment.
Product Dimension
Connects via ProductKey to provide SKU-level details and material profiles for sustainability metrics.
Supplier Dimension
Linked indirectly through the Product table to map sales back to factory-level ethical certifications and carbon risk.
Brand Dimension
Connects via BrandKey to facilitate high-level performance reporting and brand-specific procurement strategy.
Predictive Success: Power BI ETS Forecasting vs custom Python model
By implementing a custom Random Forest Regressor, the model outperformed standard automated forecasting tools by capturing non-linear seasonal spikes.
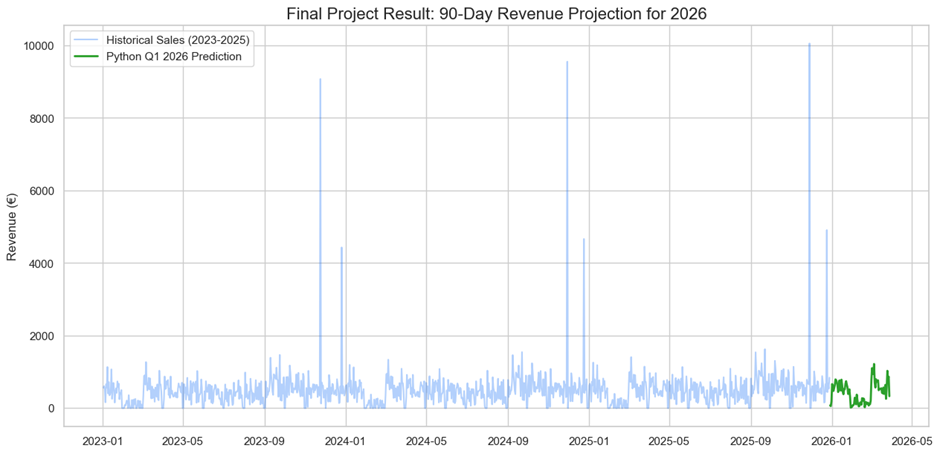
Figure 2: Performance Comparison - The Random Forest Model successfully identified 2025 seasonal peaks.
| Metric | Power BI (ETS) | Custom Python Model (RF) |
|---|---|---|
| Forecast Accuracy | Significant Underestimation (-70%) | Capture of high variance |
| Revenue Forecast | Allowed Negative Projections | Positive only Projections |
| Business Utility | Passive Reporting | Proactive Guidance for procurement |
Trend Data Linking: Mapping External Market Sentiment to Internal Inventory
This facilitates predictive insights into seasonal garment demand. By integrating sales history and simulated market trends, this architecture allows for granular slicing through a 5-part TrendKey, providing visibility beyond traditional brand-level reporting.
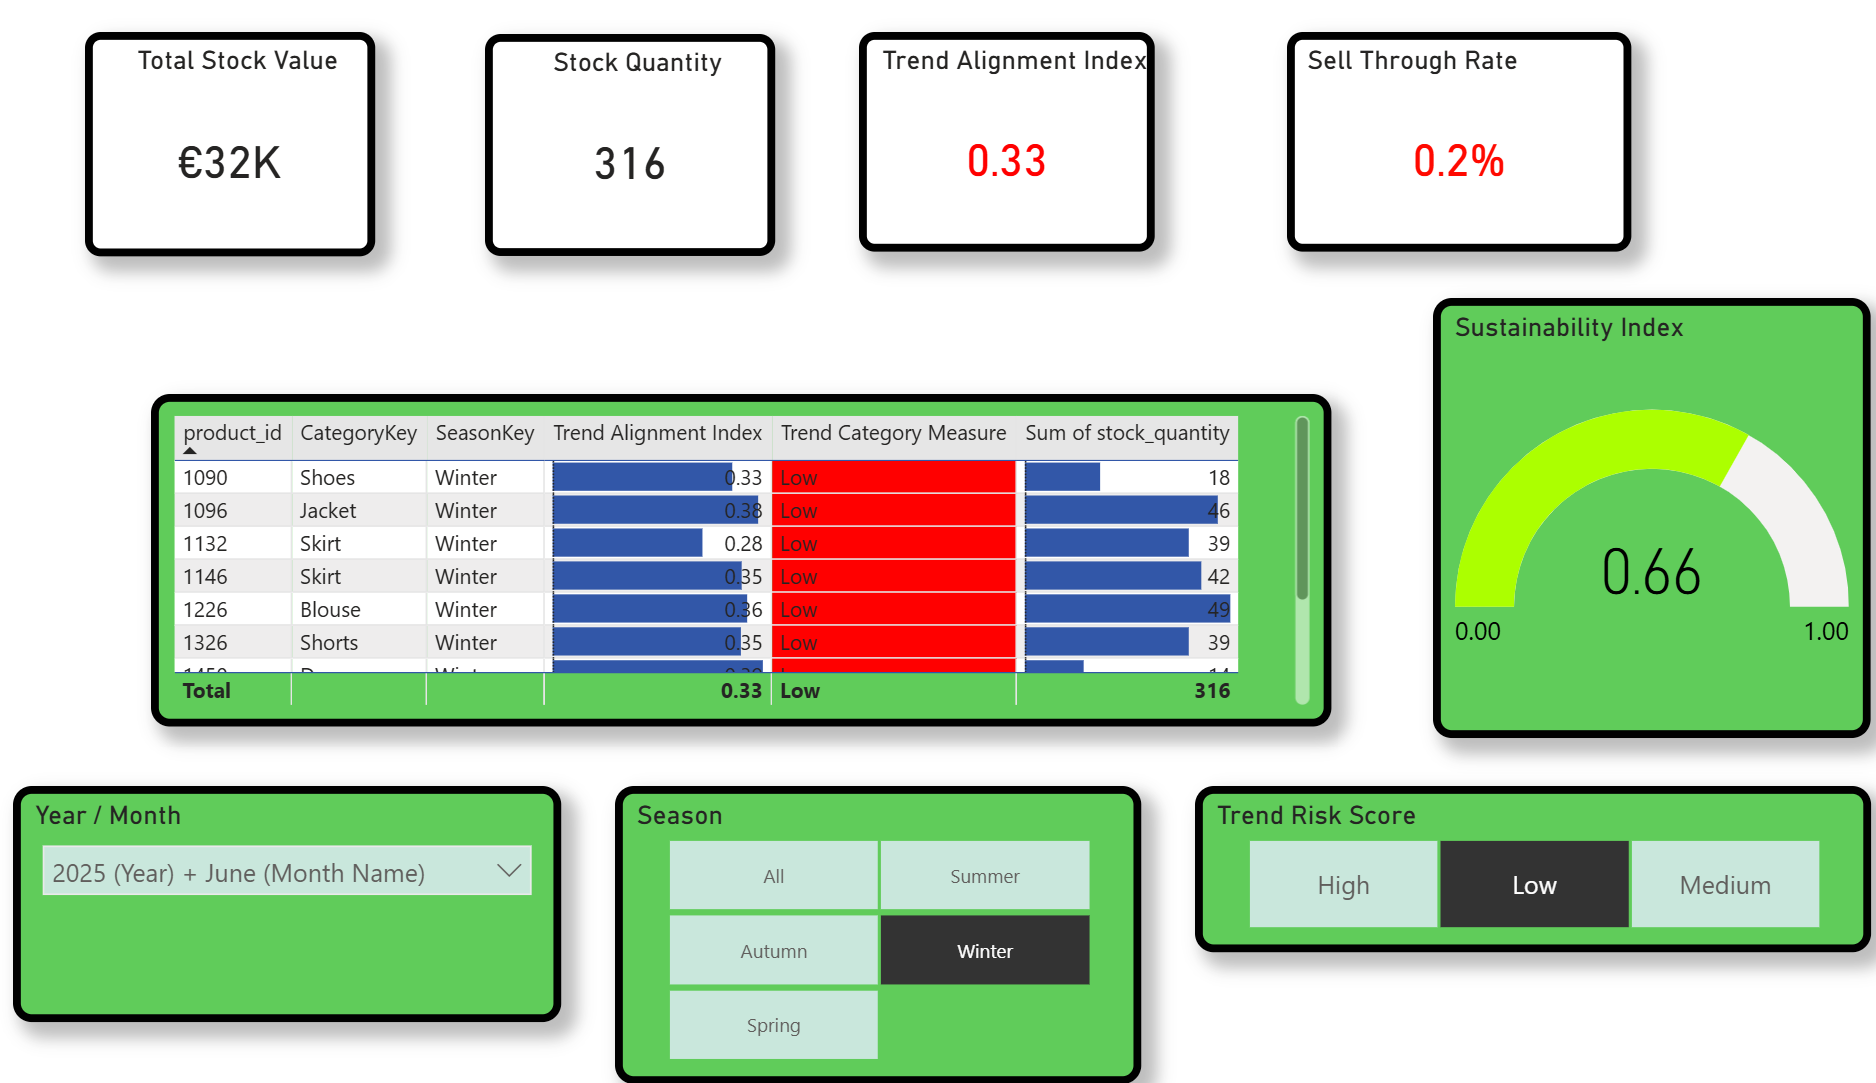
Figure 3: Trend data linking and market sentiment mapping.
Trend Alignment Index
The average market desirability score of every unit successfully sold. Scores range from 0.0 (not in demand) to 1.0 (peak trend).
A Predictive Demand Signal used to align JIT manufacturing with market trends. This prevents 'mini-trends' from reaching landfills like the Atacama Desert in Chile, where synthetics persist for 200 years.
Trend Risk Score
- Low Risk / High Trend: Items in the top quartile of market desirability (Strong clearance probability).
- High Risk / Low Trend: Items in the bottom quartile of market desirability (High waste potential).
Sell-Through Rate (STR)
Measures the velocity of a particular product or trend by comparing inventory sold against quantity received. This serves as the primary validator for trend accuracy.
Sustainability Index
Averages normalised material scores across the catalogue (1.0 = Sustainable, 0.2 = High Impact Synthetic).
- Low Impact: Organic cotton, Recycled wool, or Tencel (Scaled toward 1.0).
- High Impact: Conventional cotton or Polyesters (Scaled to 0.2 baseline).
- Threshold: The 0.2 floor identifies the lowest acceptable sourcing, flagging non-certified materials as 0.1 (Unacceptable).
Ethical Assortment Planning
Designing a unified data model to determine the ideal product mix while integrating sustainability metrics.
(Click any dashboard below to enlarge)
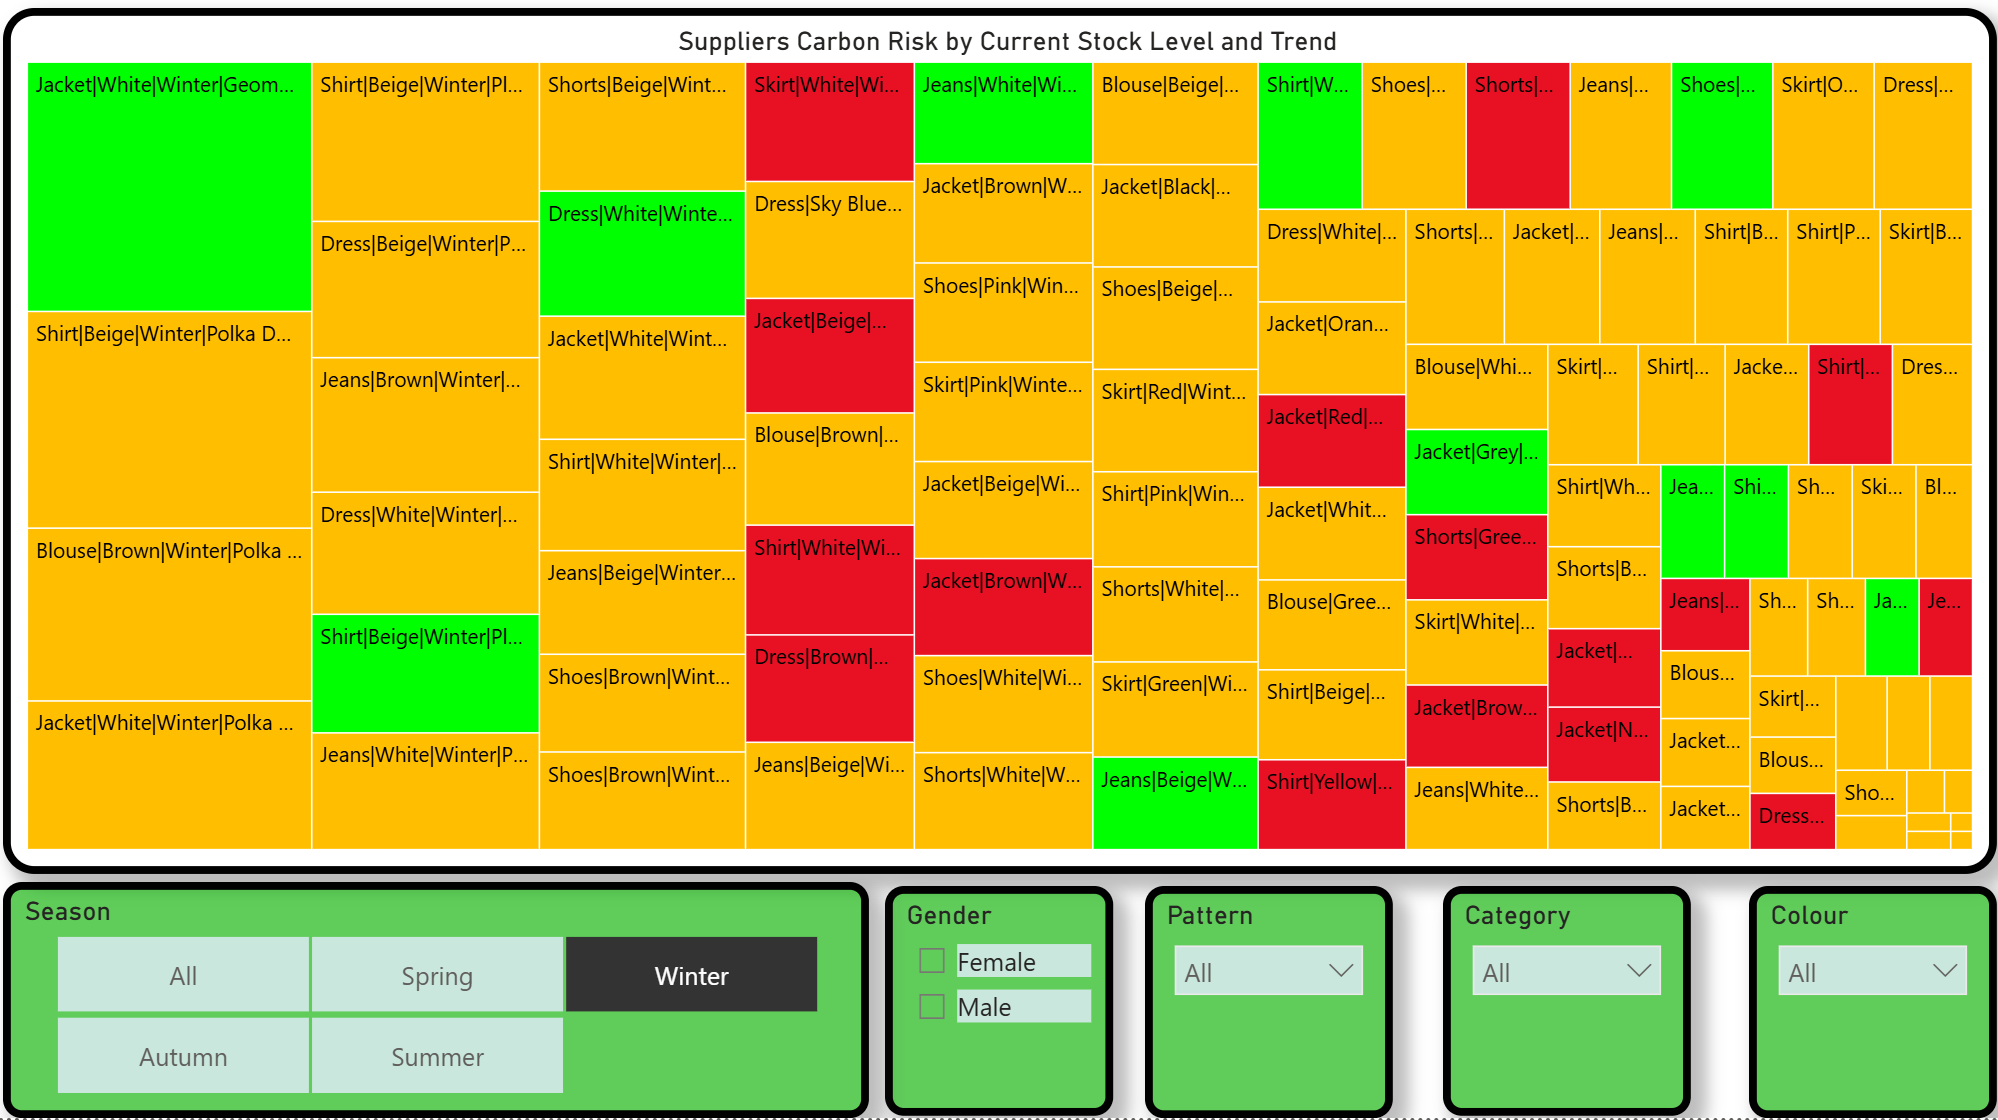
Figure 4: Carbon Risk
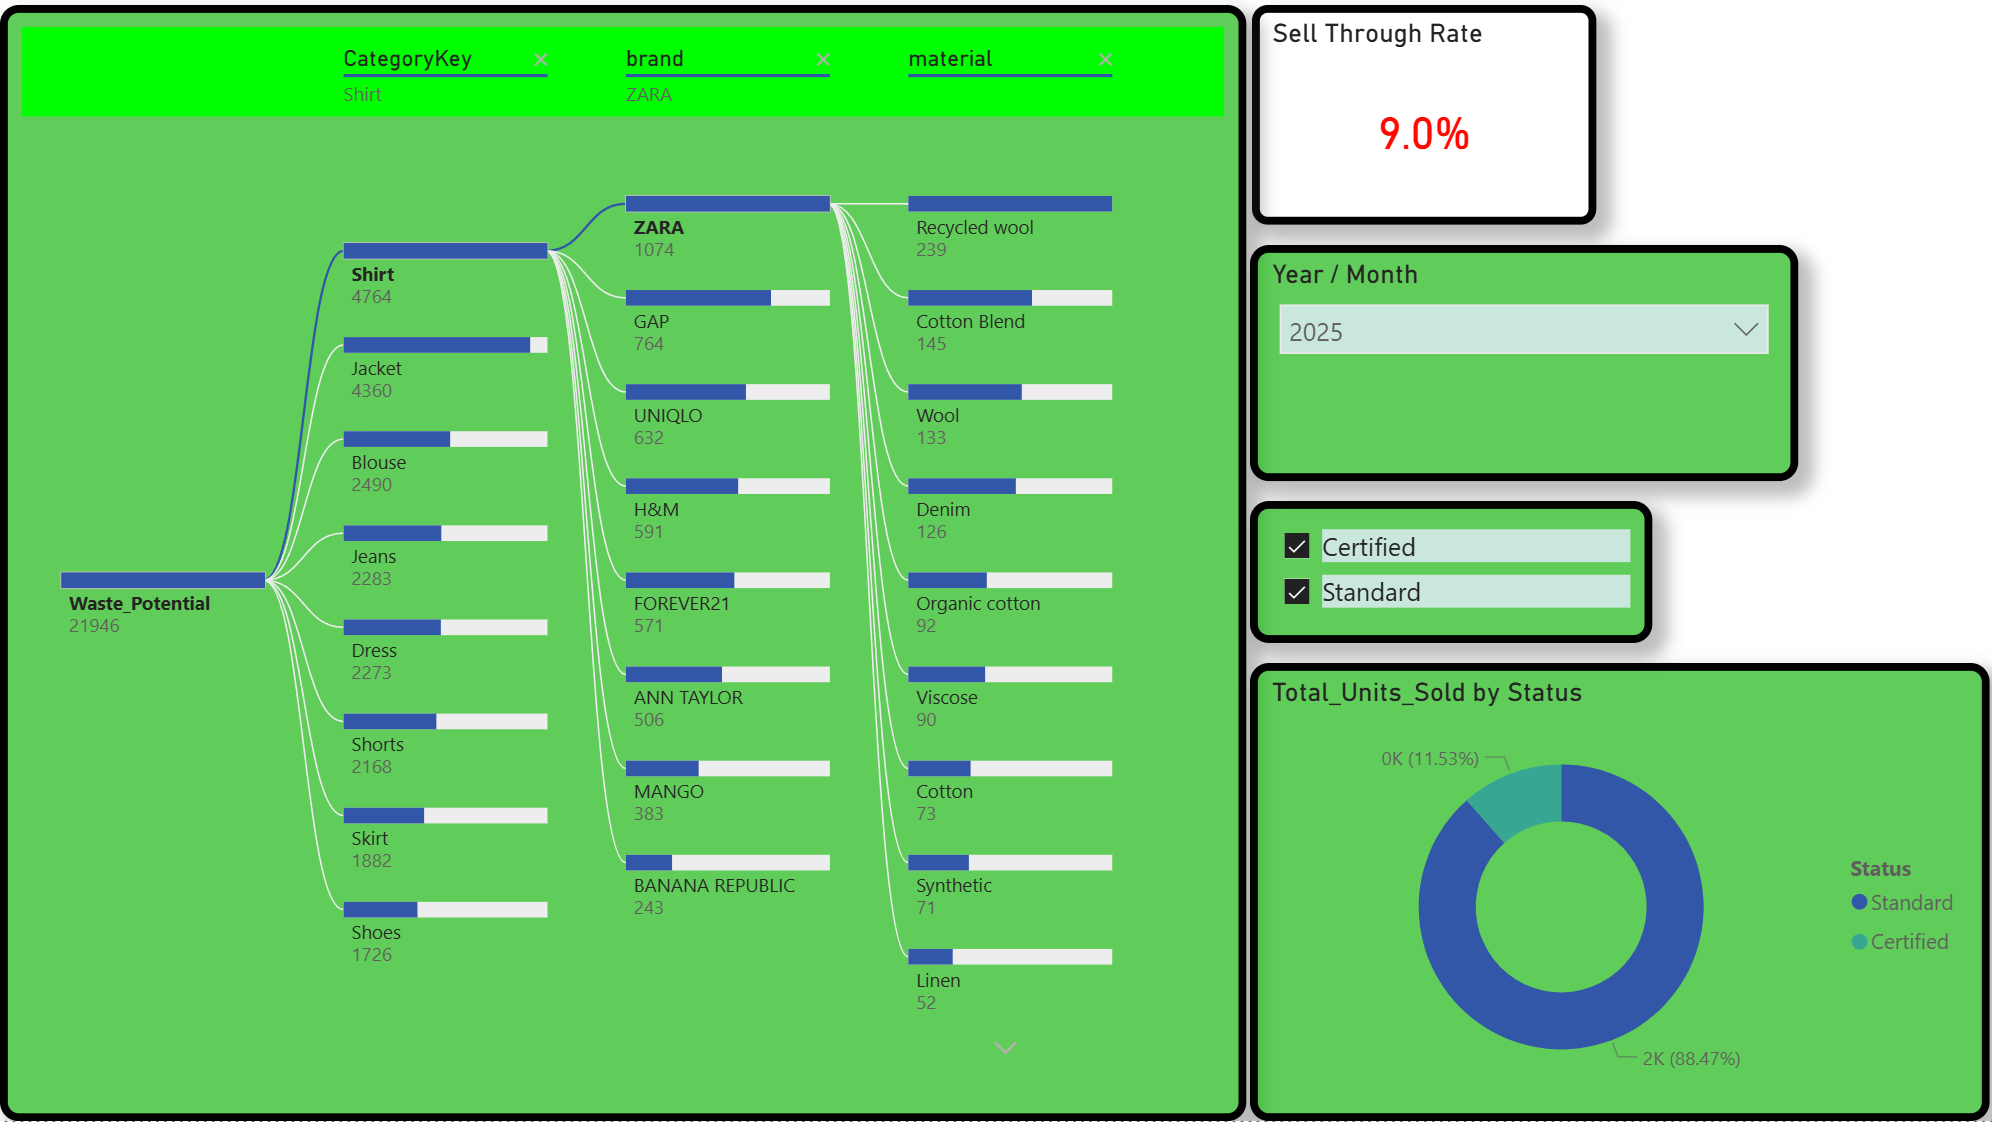
Figure 5: Waste Potential
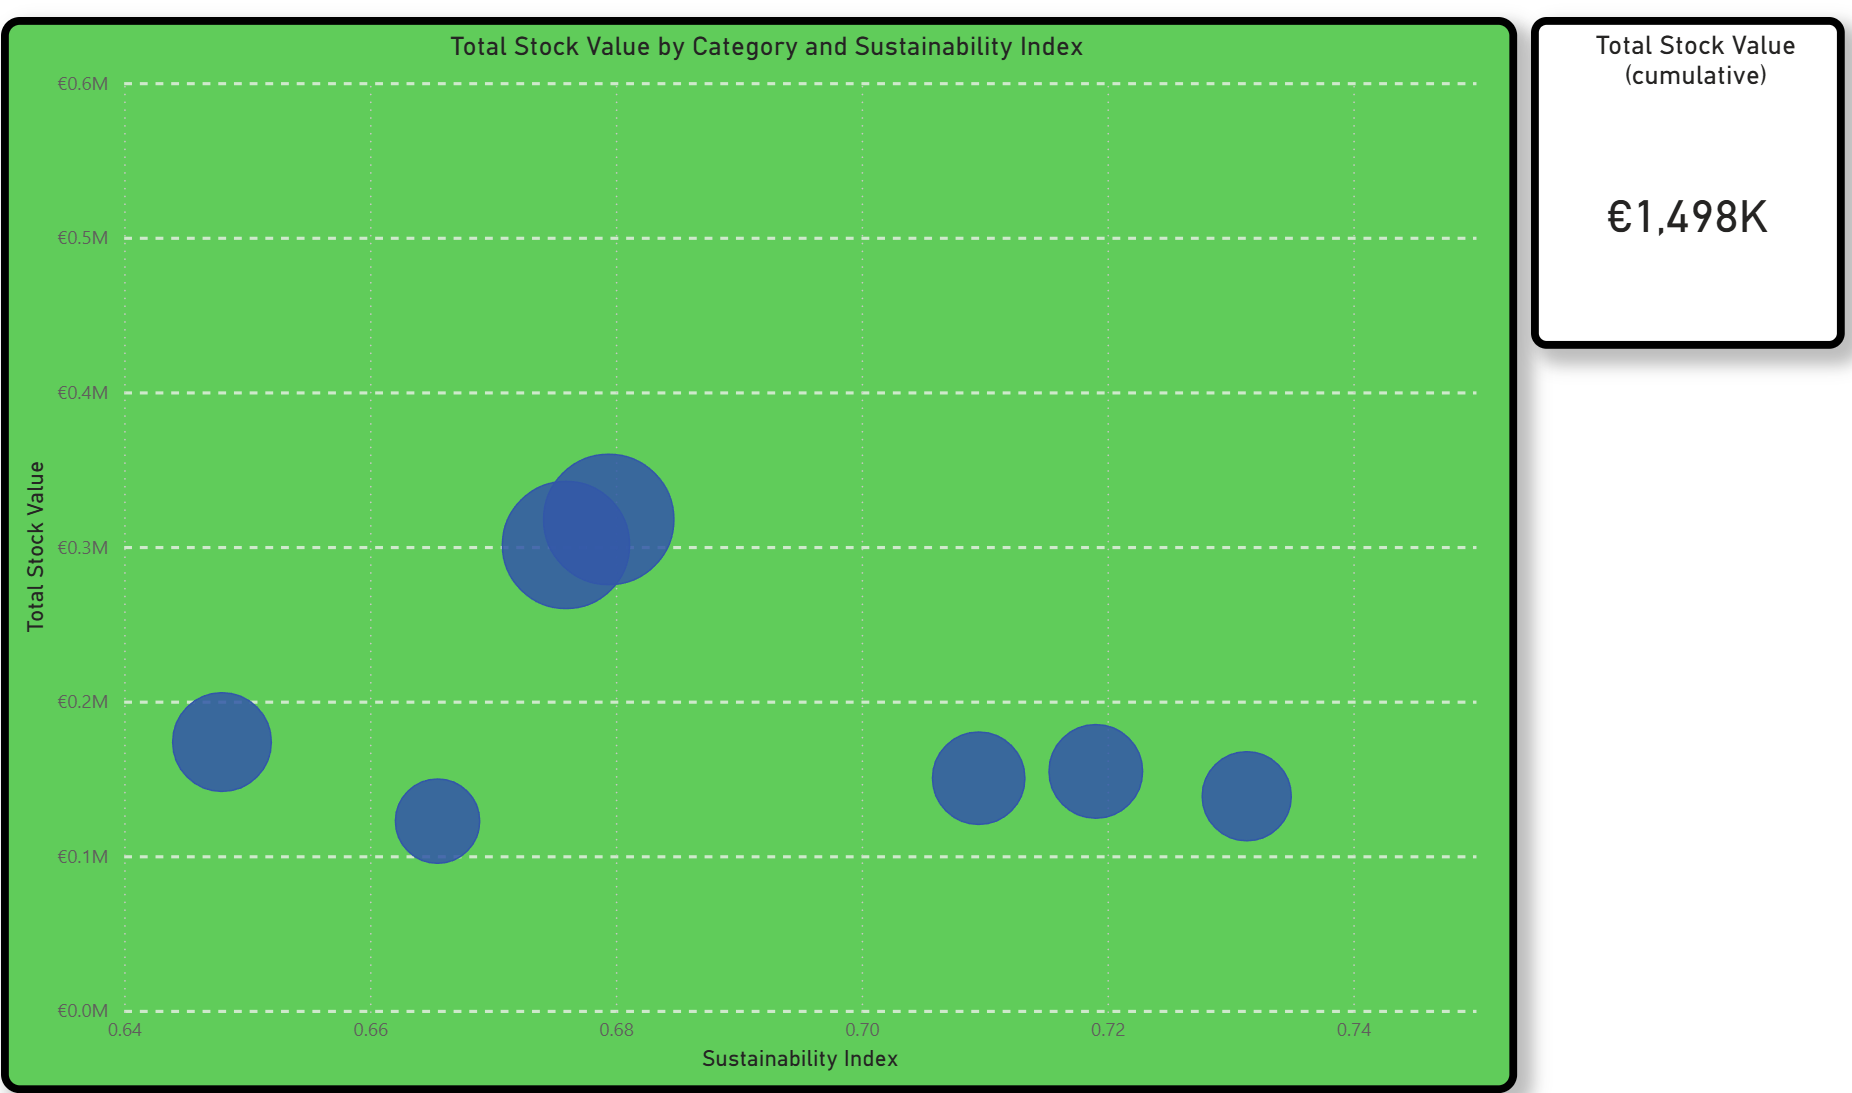
Figure 6: Sustainability Index
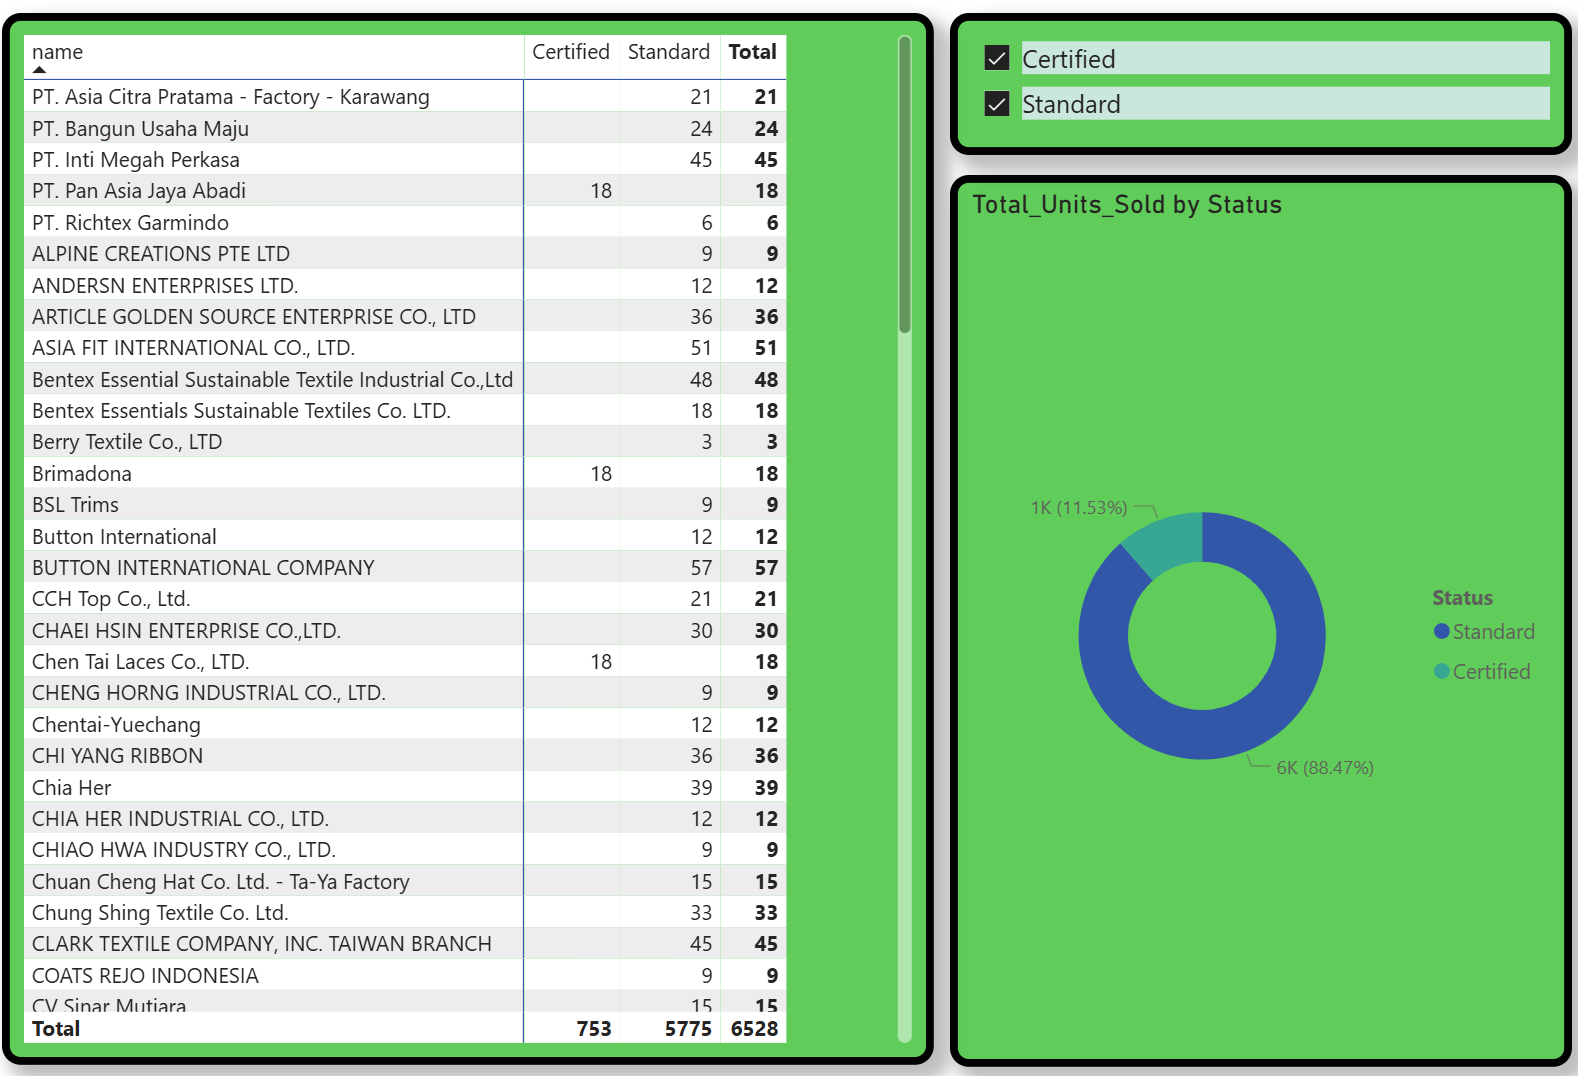
Figure 7: Ethical Coverage
Carbon Risk Score [Figure 4]
A strategic metric auditing supplier environmental impact scored from 1 (low risk) to 3 (high risk). It flags high-intensity processes like dyeing and laundering while rewarding Fair Trade and BCI certifications.
Waste Potential [Figure 5]
Highlights product lines that have a low sell-through rate ( < 50%). This process links the commercial failure to the environmental cost of unsold stock (deadstock).
Sustainability Index [Figure 6]
The Sustainability Index is a normalised rating from 0 to 1 that measures the environmental integrity of a product's fabric. Inspired by the Higg Materials Sustainability Index, it scores materials on a range from least sustainable (high-impact synthetics) to most sustainable (e.g. organic cottons). This KPI allows the brand to instantly identify high impact material within the inventory and shift procurement toward low-impact, circular textiles.
Ethical Coverage [Figure 7]
This measure shows how much of the current inventory holding is protected by a certification such as Fair Trade. This KPI is calculated as the percentage of total sales volume that comes from Certified vs. Non-Certified products.
Strategic Outcomes & Business Value
Financial Recovery
- Capital Gain: Identified €618,000 in stagnant capital tied up in low-velocity categories (Shirts/Jackets).
- Waste Mitigation: By transitioning to a JIT model, the project aims to ensure optimal inventory levels and reduce the environmental impact of unsold deadstock.
- Forecasting Accuracy: Replaced standard ETS models with a Random Forest Regressor to successfully capture high-variance seasonal peaks that standard tools underestimated.
Operational Change
- From Push to Pull: Moved the procurement logic away from speculative 'Push' manufacturing toward a Demand-Driven 'Pull' system.
- Risk Transparency: Revealed that 88.5% of current volume lacks ethical certification, identifying the need for supplier auditing.
- Sustainability Index applied to high-inventory categories to ensure that capital-intensive stock aligns with long-term ESG targets.
2026 Action Plan
- JIT Implementation: Transition from 'Push' to 'Pull' procurement, automating restocking to ensure all categories meet the 50% Sell-Through Rate (STR) efficiency benchmark.
- Ethical Sourcing: Double ethical sales coverage to 23% by prioritising certified partners and reducing the current 88.5% reliance on uncertified suppliers.
- Inventory & Waste Mitigation: Deploy targeted liquidation for high-impact deadstock and reduce buy orders for carbon-intensive segments to protect margins and environmental commitments.